


The Economic Landscape #7
Week Ending January 27th, 2023


Reliable Sources
Here are all Fed links in one place. Each of the twelve Federal Reserve Banks (and one Bank to rule them all) has a unique set of economic indicators they monitor:
Consumer & Employment
Composite Employment Numbers — Very slowly, initial claims fell further while continuing claims rose. With more frequent announcements of larger layoffs, I’ve been wondering why Initial Claims haven’t risen, but these won’t hit the number until severance packages expire, and then only if the laid off workers, finding it difficult to get new jobs, apply for unemployment.

Core PCE rose 0.3% MoM compared to 0.2% the prior month.
Personal Income rose 0.2% MoM compared to a downwardly revised 0.3% prior.
Personal Spending fell 0.2% MoM compared to a downwardly revised -0.1% prior.
Housing
30-year Fixed Mortgage Rates fell to 6.13% v. the prior week’s 6.15%.

New Home Sales continued their decline but still rose to 616K from a downwardly revised 602K prior. Initial numbers have been coming in high and then revised down after reporting in 5 of the last 6 months.

Pending Home Sales rose by 2.5% last month after falling in 12 of the last 13 months.
Manufacturing & Services
Richmond Manufacturing Index fell back to a contractionary -11 from its one-month excursion back into positive territory at +1 the prior month.
Durable Goods Orders rose 5.6% compared to a prior decline of 1.7%. This number got a big boost from transportation orders because Core Durable Goods Orders were down 0.1%, the same change as the prior month.
Preliminary Wholesale Inventories rose by 0.1% MoM from an upwardly adjusted 0.9% rise the prior month. Businesses are still producing more product than is being consumed, possibly signaling the need to cut back future production.
Flash Manufacturing PMI shows conditions are:
Worsening faster in Australia, Japan, and Germany
Worsening more slowly in the Eurozone, the UK, and the US
Improving faster in France
Flash Services PMI shows conditions are:
Worsening faster in France and the UK
Worsening more slowly in Australia and the US
Improving faster in Germany and the Eurozone
US Economy
Advance GDP for 4Q22 was 2.9%. This one is sneaky, because we don’t get the actual Q4 number until the end of March. “Advance” comes out end-Jan, “Preliminary” end-Feb, and “Final” end-Mar, but the Advance number has the greatest market impact.
Advance GDP Price Index (aka the “Price Deflator”) measures the total price inflation of all products and services that go into the GDP number. This month the Price Deflator measured 3.5%.
If the value of all products sold (GDP) was up 2.9% but the price of those products has inflated by 3.5%, then actual goods and services produced fell by 0.6%. I’ll have to untangle this all in a future Musing.
US Debt Ceiling of $31.381 trillion was hit last week. Professors Rogoff and Reinhart found that it’s the ratio of debt level to GDP that predicts the future health of a nation. You can’t just look at debt (spending): you must also look at the size of the economy (GDP). Their research suggested that debt-to-GDP above 90 should send up a red flag — the US is well over 100 and into the danger zone already.

In a recession, GDP shrinks, meaning that the debt ceiling should come down, not be raised, to keep us steady. [The most reliable projection I’ve seen for future US debt-to-GDP ratio is from Luke Gromen at FFTT-LLC. This exponential ramp will be a combination of debt rising and GDP falling. Uncharted territory.]
US Goods Trade Balance fell to a 90.3B deficit last month from an 82.9B deficit the prior month. It is normal for us to run a deficit, but this is still larger than usual, meaning we’re importing more goods than we’re exporting. The world counts on this to support their own production and as a source of US Dollars flowing into their economies.
The CB’s Leading Index fell sharply again in December, down 1.0% m/m versus a downwardly revised 1.1% decline the prior month. This is the 10th straight month of worsening conditions.
Financial Conditions Index is showing mild easing while the Fed is doing all it can to tighten to fight inflation.

The first GDP estimate has been put out as 0.7% by GDPNow for Q1 2023, but this number will move as more data comes in. The general belief is that the final Q1 GDP is more likely to have a negative sign in front of it than a positive one.
M2 Money Supply fell this month while GDP was rising, which brought velocity up to 1.22. M2 itself fell to $21.2 trillion, down 0.69% from the prior month.

Core PPI — Despite the excitement of headline PPI YoY dropping again, Core PPI (excludes food and energy) continued its steady but slowing rise, climbing 0.1% MoM, slower than the 0.2% rise in the prior month. This is the 30th consecutive month of rising rates. As long as the prices producers are paying for supplies keep rising, they will have to make the choice whether to eat the loss and hurt profit margins or raise prices to the consumer and risk revenue loss.

The blue line on the chart below is the full (not just core) PPI and, in the bottom panel its monthly rate of change. You can also see why tossing out food and energy isn’t a completely stupid number: they vary a lot and hide the underlying trend in the economy. It’s an economist’s view, not a consumer’s.

More subtly, the charts show why month-over-month (MoM) comparisons contain more current and useful information. PPI is coming down rapidly MoM but a year ago it was lower and rising rapidly. PPI YoY is up now, will come down toward zero over the next couple months, and turn negative 4 to 6 months from now: looking at PPI MoM shows us already steeply falling. The reason I use Core PPI MoM is that it tells me a truer story, that the underlying cost of goods has been rising steadily for 15 years (only negative in 7 months) and continues to do so, faster than the long-term rate but at a slower rate than the prior month.
Core PPI MoM is a more stable overall indicator (labor is a large part of the core) — PPI MoM whips us around a lot, and in a few months PPI YoY will be painting an incorrect picture of shrinking prices, but it does let us see the combined effects of food and energy price changes.
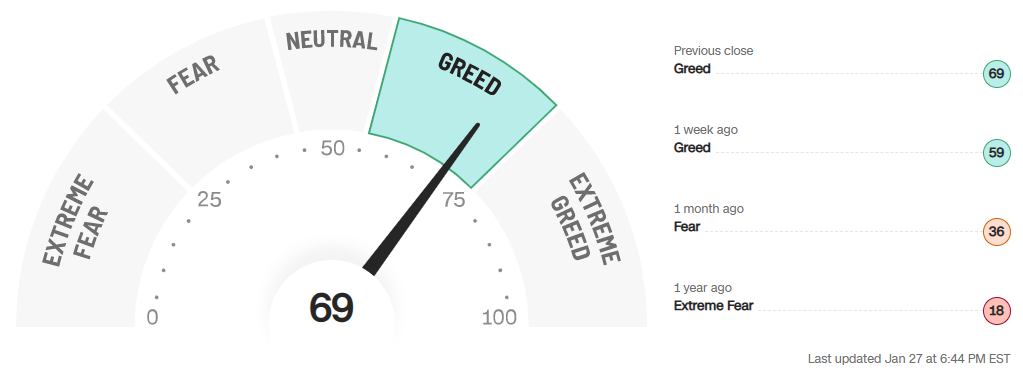
CNN’s Fear and Greed Index rose to 69 this week from 59 prior. “Greed” still describes the mood of the day. [Reminder - At CNN’s website, you can also see the seven factors that go into the Fear and Greed Index.]
Commodities
Natural Gas Storage levels fell by 91 Bcf after falling 81 Bcf the week before.
Crude Oil Inventories rose by 0.5M bbl last week compared to an 8.4M bbl rise the prior week.
Gasoline Price is up 6.5% YTD, rising for the first time in 6 months. Higher crude costs and reduced utilization of refinery capacity are factors.

Global Economies
Soybeans Headed to China — Here is a GPS-based graphic showing all of the ships currently at sea carrying soybeans to China. Despite China’s new alliance with Brazil that cuts the US out of China’s soybean supply chain, we are still seeing more shipments originating in the US.

Chinese Revenge Spending — Chinese savers have accumulated an extra $2.6 trillion during their pandemic lockdowns. There is hope that we will see a binge of “revenge spending” as they come out of lockdown, much as we did in the US. If so, travel, leisure, and luxury goods should do well.
The UK’s Industrial Order Expectations fell sharply to -17 from -6 the month prior.
German GfK Consumer Climate is bad but improved to -33.9 from -37.6 the prior month.
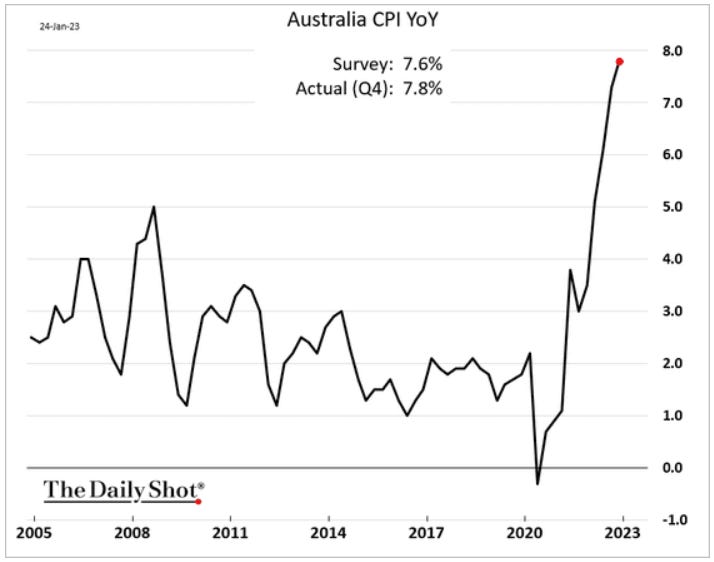
Australia’s CPI continues to climb faster than forecast, with YoY inflation coming in at 7.8%.
Personal Finance
Disclaimer: I am in no way, shape, or form licensed to offer financial advice. Notes here are simply explanations of what I myself am doing. I won’t discuss individual tickers on this site. If you have specific questions, I’m happy to discuss them via email.
According to Chris Murphy at Susquehanna, when the SPX price volatility index, the VIX, is above 30, we should buy SPY; when VIX is below 20, we should sell SPY. VIX between 20 and 30 is called “chop” — prices move up and down, but the mean is flat: you need a different set of indicators to trade that regime. Options are opposite. High volatility raises the option premium, so you want to be an option seller; when premiums are low, you want to be an option buyer.

According to Goldman Sachs, pension plans are fully funded for the first time in 15 years. I think with the slow mark-to-market issues out there this number is too high.

I’m still thinking my way through this, but here is how the Fed’s QT program is reducing the assets on their balance sheet. To-date, QT has taken $476 billion of liquidity out of the economy.

M2, my preferred measure, is down by $500 billion. My dilemma is that the Fed has raised effective interest rates by over 5%, and this has a tightening effect as well, but it is not showing up in M2. Or maybe some of it is, but there can be a long lag time between Fed actions and their appearance in economic numbers. Another topic I need to muse upon.
Thanks for reading,
Ed
Glossary/Acronyms
bbl - barrels (usually of oil or its distillates)
Bcf - billion cubic feet (usually of natural gas)
BLS - Bureau of Labor Statistics
CB - Consumer Board
CPI - Consumer Price Index
Core CPI - CPI minus food and energy
Core PPI - PPI minus Transportation
CS - Case-Shiller
Duration - the time until something happens (bond matures, you retire, …)
ETF - electronically-traded fund
EU - European Union
EZ - Eurozone (all of Europe, including EU countries)
Fed - US Federal Reserve (sometimes refers specifically to the FOMC)
Flash - an early reported number (more closely watched than the final often is)
FOMC - Federal Open Markets Committee
GDP - Gross Domestic Product
IBD - Investors Business Daily
IFO - Information and Forschung Institution
ISM - Institute for Supply Management
NFIB - National Federation of Independent Business
PCE - Personal Consumption Expenditure
PMI - Purchasing Managers Index
PPI - Producer Price Index
Prelim - same as Flash (see above)
S&P - Standard & Poor’s
SPR - Strategic Petroleum Reserve
TIPP - Technometrica Institute of Policy and Politics
UoM - University of Michigan